Battery Testing Using Impedance Measurements
This article considers ohmic measurements as a means of identifying rogue cells and monoblocs of VRLA AGM and GEL product installed on float standby systems. For batteries operated on cycling applications there are better ways of identifying rogue cells or the end of life for the complete battery. For vented product, the established method of visual inspection, float voltages, specific gravities and ultimately discharge testing are more reliable than predictions based on ohmic measurement.
Searching the internet will show that there are many articles discussing battery ohmic measurements. Some will be written by operators such as telecommunication or UPS companies whilst others will be from instrument manufacturers and papers written by battery manufacturers are also available. Rarely is an article written with the intent of giving an overview of the subject and guidance for the interpretation of the results obtained and actual case examples. This article will show that whilst ohmic measurements may be used to identify rogue cells or monoblocs, the results can also be very misleading and may give the operator a false sense of security, or condemn product that is still fit for purpose.
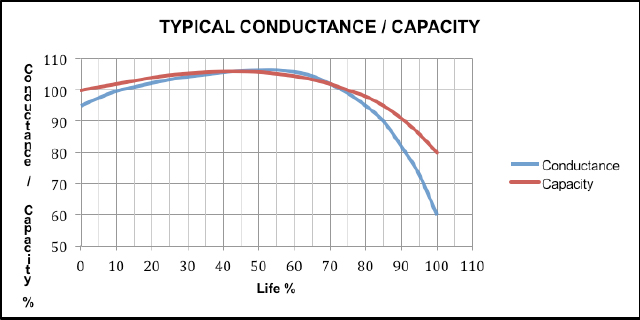
It has been shown that when ohmic values for a battery are compared over time, they can be used to predict the end of life. (See FIG 1 below). Care must be taken on drawing the wrong conclusions when comparing the results over time. Rogue cells can skew the results and it must be understood that the ohmic value of a cell will change in a none-linear way over time. Typically, the ohmic value will become better over the first years of service before falling away as the end of life approaches. This fall off may be steep and measurements taken on an annual basis may not be sufficient to identify imminent failure. It has also been shown that whilst the ohmic change is not linear with time, similarly the expected performance is also not linear with time and cannot be correlated with the change in ohmic value without detailed information of the instrument and product characteristics. If long term monitoring of cells is used to predict the end of life, the operator should consult with the equipment manufacturer and battery manufacturer to obtain the best possible predictions. Establishing the base ohmic value is essential and this should be done after an initial stabilising period of approximately six months in service.
It has been suggested by some instrument manufacturers that a value more than 30% different in the negative direction from the base number represents a failure. This may or may not be correct depending on the instrument used and the product being evaluated.
Ohmic measurements can be taken on large vented (wet) lead acid batteries but most of the instruments available are aimed at VRLA product of less than 500Ah. In this article, we look at a variety of VRLA AGM products. The principal can be extended to GEL product but it would not be practical to extend this to vented cells.
Although it is rather academic and mainly only for the interest of Chartered Engineers, it is worth looking at what is meant by ohmic value. There are three values for us to consider as follows: -
DC RESISTANCE: R = V / I
AC IMPEDANCE: Z = √ (XL2 + R2)
AC CONDUCTANCE: S =1 / (√ (XL2 + R2))
The internal ohmic value of lead acid batteries are made up of all three components listed above and can also be described as more complex because cells also have a capacitance and inductance which interact with each other to give an overall ohmic value. Understanding the overall value and using this to determine the health of the battery is what users search for, but is not easy to draw conclusions.
There are many instruments available on the open market that claim to show the state of health and overall performance expectations. Most of these instruments will give an ohmic and will leave the interpretation to the discretion of the user. The user will often contact the battery manufacturer for “base numbers” for the battery being measured and from this some sort of conclusion can be reached. What is missing is that different instruments will give different results and some real results for different instruments are given below.
Four different instruments were used to establish the ohmic value of a 12V 90Ah monobloc and the results are given below along with the manufacturers declared internal resistance. All four instruments claimed to measure the impedance but one actually measured the DC resistance. The manufacturers internal resistance was determined by the method described in IEC 60896 21-22 and not by using a measuring instrument.
Instrument “1” - 2.72mΩ
Instrument “2” - 3.39mΩ
Instrument “3” - 3.80mΩ
Instrument “4” - 6.49mΩ
IEC 60896 21-22 Method - 5.20mΩ
The inevitable question is “which is the correct value”? The answer is that all the readings are correct. Each instrument uses a different method to determine the “impedance” and it follows that each instrument will show different impedance. It follows that unless you have a “base number” for the specific product using a specific instrument, correlation cannot be made between the base value and readings obtained for batteries in service. It has also been shown that the actual method used can also affect the results. Specifically, the point on the cell or monobloc where the measurement is taken will, in many cases affect the result. Some instruments are more sensitive than others in this respect. A measurement taken on a bolt head can be significantly different to that taken next to the bolt on the connector. All measurements should be taken in the same way. Different values can be seen if the battery is on line or off line due to charger and load induced ripple.
The most consistent values are obtained by using the IEC 60896 21-22 Method which involves discharging the cell or monobloc at two different currents and then calculating the resistance using a formula. It does not matter if the tests are carried out by an independent laboratory, user or manufacturer; the results will correlate well within experimental limits.
Using the IEC 60896 21-22 method, the Internal Resistance is found by: Ri = (Ua – Ub) / (Ib – Ia) in ohms
However, it is not practical to use the IEC 60896 21-22 Method on a battery in service. As a consequence, ohmic measuring test instruments have been developed which will measure the impedance, conductance or resistance of cells and monoblocs whilst in service. Some instrument manufacturers claim that the devices they offer are immune from ripple generated by the charger or load and will detect all types of battery failure from internal shorts to end of life.
Some will argue that it is essential to have the base number for comparison purposes and this brings its own problems. The spread of ohmic values from a batch of lead acid cells or monoblocs can easily be ±10% or more within two standard deviation. With this type of spread in values, the process of identifying rouge cells or monoblocs becomes difficult. We also have to establish the value to consider for replacing a cell or monobloc. Even with the practical difficulties of establishing a base value, this should be done where ever possible. The best way of establishing a base number is on a new battery that has been in service for six months. During this time, the product will stabilise in both float voltage and ohmic value terms. The float voltage and ohmic values will have a lower spread as the product settles down. This assumes that no discharges have taken place. If the battery has been discharged, then a further 6 months stabilisation period should be applied. Then, using a selected instrument and test method, all cells or monobloc values should be measured and recorded for future reference. At that time it may be decided to consider failure as a given percentage from the mean value. Caution needs to be applied because stipulating too tight a tolerance will result in good product being rejected whilst a tolerance that is too wide may leave the installation exposed.
Battery manufacturers and users have been using ohmic measurements for some years. In many cases these have been successful in finding weak cells or monoblocs before failure occurs when the float voltage has been within acceptable limits. However, in some cases the instruments used have either failed to identify weak product or have condemned product that was still serviceable. Below are real case examples of what has been found in the real world.
For information, the typical conductance and capacity against life for a VRLA AGM cell is shown in Fig 1 below.
FIG 1
CASE 1: High Resistance Monitor Connections
In a real case study 3 x 12V monoblocs from a battery of 66, were rejected by the customer. The battery had been in service for over 18 months with a hard wired impedance monitoring equipment. It had previously been established beyond reasonable doubt that the base impedance for the monobloc type was 3.00mΩ. In the 18 months no problems had been recorded and no alarms triggered. Three monoblocs triggered the high impedance alarm and the customer replaced them... The customer understood that a stabilising period was required and although the impedance was out of specification, the float voltage did not trigger an alarm. However, after 6 months, the impedance was still out of specification and impedance alarms were still being triggered.
The customer was not happy that 3 blocs failed and the replacements also triggered the high impedance alarm. The three subject blocs had impedance values of 7.8mΩ, 7.9mΩ, and 12.4mΩ, (base value 3.00 mΩ). It was not identified if these values were steady, or variable. The blocs were removed from site and evaluated under controlled laboratory conditions.
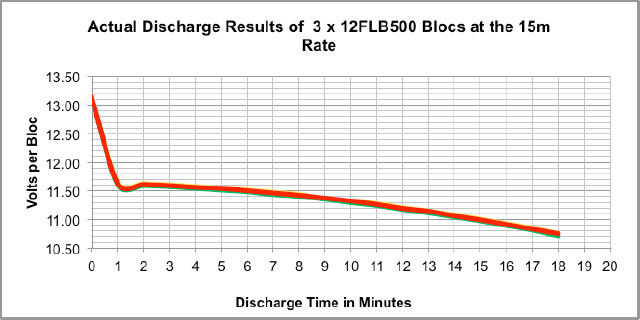
The battery was installed on a 15 minute UPS application and it was decided to test the blocs at this rate in the laboratory. They were tested without recharging to avoid any influence this may have on the test results.
The expected run time based on the bloc actual temperature of 14⁰C was 13 minutes to 10.2Vpb. The actual run time was in excess of 17 minutes for all three monoblocs.
The results are given in graphical form in Fig 2 below.
This example shows that the impedance values obtained on site were not representative of poor product performance. Possible explanations being; a) poor connections between instrument and monobloc, b) different connection points on the monoblocs, c) instrument inaccuracies, or d) an installation fault.
It was decide to carry out a site visit to try and establish the cause of the discrepancy. The product had been installed correctly, the float voltage was correct and there were no apparent faults with any of the equipment that may cause the problem. Because the battery had a “hard wired” impedance monitory system, it was decided to carry out cross reference checks using a hand held instrument. This showed a problem with the hard wiring and several connections between the monitoring cabling and monobloc had a high resistance. Once the faults had been corrected, the system operated successfully with no alarms being generated. The system was monitored over the following two years and the alarm tolerance was progressively reduced until a final value of ±10% about the mean was considered to be acceptable.
In this case, faulty monitoring equipment resulted in false alarms.
FIG 2
CASE 2: (Low Conductance Manufacturing Fault)
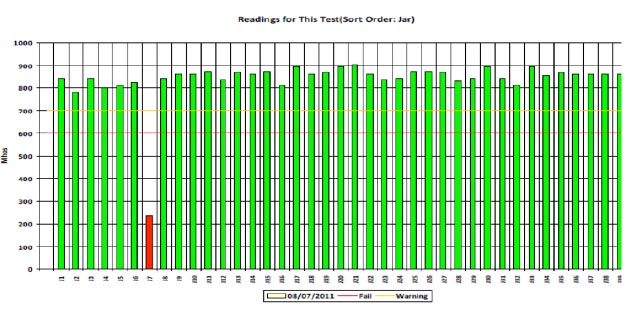
A new battery of 40 x 12V 60Ah blocs installed on a UPS machine with a service contract was identified as having 1 bloc with low conductance.
Although a base number had not been establish, an estimate had been given by the instrument manufacturer of 1000mohms. This was applied to the test results.
The float voltage was low but not to the extent that it represented a failure. See bloc J7 in Table 1 below.

The bloc was removed from the battery and discharge tested at the 30m rate without being recharged. The run time was 22m 14s proving that a problem existed with this monobloc. To rule out undercharging, the bloc was recharged for 72h at an average voltage of 2.40Vpc and the test discharge was repeated. The run time reduced to 19m 46s proving that the bloc had a fault. A destructive analysis of the monobloc revealed an internal short in one cell due to a bucked plate. This was a manufacturing fault.
Although the float voltage was low in comparison to the other blocs in the battery, to the untrained eye this would not have been obvious and the fault would have been missed. Eventually the float voltage would have deteriorated to a very low value and a fault would have been obvious. However, the low conductance found the fault earlier. This is a good example where the ohmic measurement identified a problem when the float voltage did not.
The graphical results are given below in Fig 3 below.
FIG 3
CASE 3: (Eight Blocs With No Correlation To Performance)
A 6 years old battery of 4 x 33 x of 90Ah blocs installed on a UPS machine serviced annually by an independent service company was identified as having problems with 8 blocs when evaluated by a portable impedance instrument. No official base value was available therefore an estimate of 2.5mΩ was used. This was derived from historical information of similar product. All 8 blocs had a float voltage within the accepted range which was selected as 13.4Vpb to 14.1Vpb.
The suspect blocs had impedance values as follows: -
3.1mΩ, 3.0mΩ, 3.0mΩ, 3.1mΩ, 2.9mΩ, 2.9mΩ, 3.0mΩ, 2.9mΩ
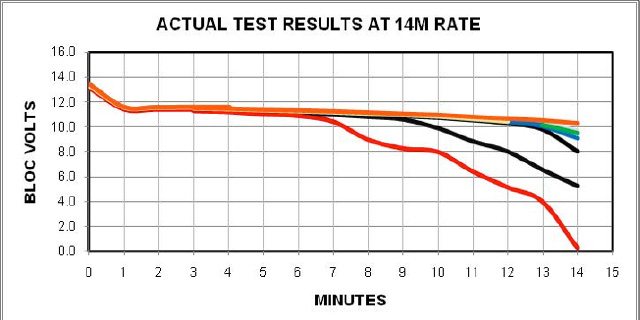
All suspect blocs were tested at the 14 minute rate 10.00Vpb, direct from site, without being recharged. The actual test results are given below in Table 2 and Fig 4 below.
Although the actual discharge test results prove that a problem existed with all but one of the 8 blocs, the actual discharge performance cannot be correlated with the impedance values. One bloc having an impedance of 2.90mΩ had a run time of over 14m whilst another bloc having the same impedance had a run time of approximately 7m 20s.
It is of further interest to note that these 8 blocs had the highest impedance of all the blocs in the battery and out of the complete battery of 132 blocs (4 x 33) a total of 42 blocs had a value higher that the 2.5mΩ base value. Based on impedance values it is impossible to state if the complete battery would, or would not perform as required.
It was recommended that further on site investigations should be carried out to try and prove the battery performance. An actual “on site” test discharge was proposed. Because of the unpredictable performance and some evidence that the battery had been subjected to a higher than recommended operating temperature, the customer decided to replace the complete battery arrangement.
In this case, the poor impedance suggested a problem which turned out to be correct even though the absolute accuracy could not be verified. Float voltage measurements did not identify a problem.
The actual test results at the 14m rate can be found in Table 2 below.
Table 2

FIG 4
CASE 4: (Unidentified Passivating)
The battery in this case had been installed less than 6 months before the failure was reported. The system was at a new installation and used for emergency lighting through a static UPS system. The fault had been reported as failure to meet a run time of 120m with a typical performance of less than 15m. It was not connected to a monitoring system and the no impedance measurements had been taken on site.
Following initial investigations it was clear that a major problem existed with the battery. Because of the “high profile” of this installation it was decided to replace all 80 monoblocs and send them to the laboratory for detailed evaluation.
At the time the battery failure was reported, the test team had three different ohmic measuring instruments available and these were used in the first evaluation process.
Although the measured values differed from instrument to instrument, this was expected and the results correlated well with a base value obtained for new product taken from stock. The base values used were as follows: -
Instrument “A”: 2.5mΩ
Instrument “B”: 2000mhos
Instrument “C”: 3.5mΩ
All ohmic values were similar with a total spread of less than 16% from the highest to the lowest using all three instruments. This 16% was well within the expected range for a battery of this age.
Eight monoblocs were chosen by the end user for discharge testing. Ohmic measurements of the eight blocs can be found in Table 3 below.
The product was test discharged at the 120m rate which was the design standby requirement on site. The test was carried out without recharging and the results are presented in graphical form below in Fig 5.
Because of the unexpected and strange test results, further onsite investigations followed. These investigations revealed that the battery had been cycled on a daily basis. Cycling of standby batteries operating on a float charging system can lead to a passivating layer being formed between the active material and grid structure. The passivating material has been described as PbOX. This layer results in a high voltage drop between the active material and grid structure when the cell is being discharged. Consequently, the terminal voltage is suppressed and the total battery voltage does not match what is required. This failure mechanism is relatively rare and is caused by a poorly designed operating system and it is not a battery fault. As can be seen in Fig 5 below, when the affected cells were discharged, the voltage did not reverse as is the norm with poor performance cells but remains more or less steady at zero volts. This can be clearly seen for bloc No 24. It is speculated that all 6 cells within this bloc were affected but in other blocs some cells were not affected to the same extent and held the voltage above zero for longer. Never the less, the steep fall in voltage followed by a more stable period suggests a passivating layer has been formed within some cells of the bloc.
It is suggested that ohmic measuring instruments cannot identify this phenomenon because the grids, top lead and active materials are not corroded and no plate sulphation has taken place compared to an internal short problem which would result in plate sulphation...
Table 3

FIG 5

CASE 5: (Three High Impedance Monobloc But No Battery Failure)
The following illustrates how a hand held impedance instrument successfully identified three “faulty” monoblocs. The instrument measured float voltage and impedance. All float voltages were within the expected range but three blocs had high impedance.
This battery system comprised 4 parallel strings each of 31 x 12V 133Ah monoblocs. The arrangement had been in service for 5 years without problems and the user commissioned an independent service organisation to carry out impedance checks. Previously, only float voltages had been measured and recorded; no faults had been identified up to this point in time. No “base” impedance value was available and therefore the only pass / fail criterion was to ensure that all values were reasonably consistent. Any abnormal values would be investigated further.
The three high impedance monoblocs and one other were removed and tested at the 3h rate to 10.8Vpb. The fourth monobloc, No AA1 was removed and used as a “control” monobloc. The performance of the three high impedance monoblocs was found to be marginally low with a run time of approximately 95% of the claimed performance. The “control” monobloc had a run time approximately 10% better than published. The three low performing blocs would not have caused a battery failure but eventually, if not replaced may have in the future. It can be argued that it was correct to replace the three monoblocs.
The impedance of the three identified monoblocs was more than double the typical value, but the actual run time was only approximately 15% lower. This case shows that although the instrument correctly identified three impedance monoblocs it could not be used to correlate the actual expected performance.
The test discharge results are tabulated in Table 4 below.
Table 4

The voltage and impedance values are given in Figs 6, 7, 8 and 9 below.
FIG 6

FIG 7

FIG 8

FIG 9

CASE 6 :(Eight Sample Blocs)
A seven years five months old battery comprising 33 x 12V 90Ah installed on a static UPS system had many monoblocs with high impedance. As an investigation, eight monoblocs were removed for laboratory investigation. The customer chose the 8 blocs and replaced these with new product.
Because the time from removing the monoblocs from the battery and being received by the laboratory was several months, it was decided to charge them at an average cell voltage of 2.40Vpc for 72h to establish they were fully charged.
The blocs were evaluated using the same impedance instrument as used on site and the results compared with actual test discharge results. The base value had previously been established as 2.71mΩ from a large sample of known “good” blocs.
A 15m rate test was used and the run time compared with the impedance value to try and establish a correlation. This would then allow a better on site evaluation of the complete battery to be carried out without having to carry out an actual test discharge.
Monobloc No 5 having an impedance of 114.8% had a very poor performance of 2m 47s whilst monobloc No 4 with a similar impedance of 112.9% had a run time of 10m 44s. The results are scattered with no reasonable correlation between impedance and performance. However, any bloc with impedance above the base value of 2.71mΩ must be suspect. The results show that it is not reliable to use impedance values as a guide to actual discharge performance.
The design life of the product was declared by the manufacturer as 10 years when tested in accordance with BS 6290 and because this battery was seven years five months old at the time of investigation, the failure may be the result of aging and not a manufacturing fault. Detailed destructive analysis of the product was not carried out.
Based on the assumption that these 8 monoblocs were representative of the complete battery, it was recommended that further on site investigations should be carried out. Following these investigations, the customer decided to replace the complete battery. Part of this decision was based on the product being seven years five months old battery
In this case, although the impedance measurements were slightly above the base value, they were very variable and when the product was discharge tested it was found to be below requirements.
Impedance and charging volts are given in Table 5 below.
Table 5

Test discharge results are presented in Fig 10 below.
FIG 10

CASE 7: Scattered Ohmic Value No Faults found
A 4 years old battery comprising 24 x 515Ah cells was reported as having several cells with low conductance values. It had previously been established that the practical conductance for the cells type was 0.20 mohms. The customer concluded that any cell with a conductance lower than 0.14mohms, i.e. more than 30% lower than the base number would be faulty. The battery manufacturer put the case that the battery was not at fault but agreed to carry out an on-site test discharge. The test was carried out at the published 180 minute rate and all cells exceeded this with the minimum run time being 181 minutes, the maximum 202 minutes and the average 192 minutes. As a complete battery the run time to the minimum voltage is accordance to International Standards was 194 minutes.
The customer was not satisfied because several cell had a conductance of less than 0.14 mohm and the manufacturer agreed to replace all 24 cells for further test work.
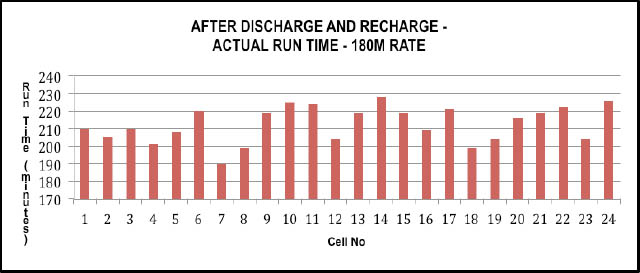
All 24 cells removed from site were test discharged without recharging at the 180 minute rate. The conductance and run time percentage results can be compared in Fig 11 below and for clarity, the conductance values have been presented in Fig 12 and the run time in Fig 13.
The results clearly show that there is no correlation between the conductance readings and the actual performance at the 180 minute discharge rate. All 24 cells achieved in excess of the design run time of 180 minutes.
Following the laboratory test discharge, all cells were recharged for 6 days at 2.28Vpc ±0.01Vpc at 20ºC and the conductance and discharge test was repeated.
The conductance average “direct from site” was 0.19 mohms and after the discharge and recharge it had improved to 0.20 mohms. Although the conductance improved, it was not large and in experimental terms we can say that there was no significant difference. In addition, some cells still had a conductance lower than the customer expected minimum of 0.14mohms.
The run time average “direct from site” was 192 minutes and after recharging the average run time was 213 minutes. This result can be explained by the battery being fully charged independently from the connected load and under a controlled charging regime where voltage, current and battery temperature were closely specified. In this case a full 6 days recharge at 2.28Vpc with a current of not less than 50A being available at a controlled temperature of 20ºC
The results were presented to the customer who then accepted that there is no correlation between conductance and run time and although the conductance values varied considerably across the 24 cells with some being lower than the 30% below the base value, it was accepted that this did not indicate a problem with any cells.
This case illustrates that conductance values alone can be misleading and suspicion of a fault should be investigated and if necessary an actual test discharge should be performed to confirm the battery capability.
FIG 11

FIG 12

FIG 13

FIG 14

FIG 15
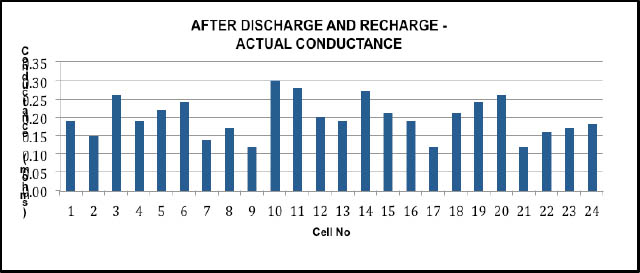
FIG 16
CONCLUSIONS
If trending of the complete battery and detailed analysis on a cell or monobloc basis is used then the reliability of ohmic measurements can be reasonably accurate but not 100%.
Ohmic measurements may assist in identifying low performance cells or monoblocs but this is not 100% reliable.
The use of ohmic measurements is better than only using float voltages to evaluate the battery condition but they are no substitute for actual battery discharge testing. If the ohmic instrument identifies a problem this should always be followed up with further investigation work to verify the actual performance...
It has been found that whilst a 30% deviation in the negative direction is a good indicator that the cell or monobloc condition has deteriorated this cannot be considered as a pass / fail criterion. Whilst it may be prudent to replace a unit whose ohmic value is more than 30% different to the base value, it should be remembered that the failure of one unit may be the first in a series leading to failure of the complete battery within the near future or the reading may not be accurate and the battery may have no faults. In all cases, further investigation to identify the reason for the deviation from the base value should be carried out.
It is important to keep records of the ohmic measurements and any deviations from the normal should be thoroughly investigated.
In all cases, an alarm caused by a deviation in the ohmic value should be followed up by further detailed investigation.
Latest Headlines
Bulk Orders
Discounted prices are available for bulk orders, please contact us to discuss your requirement.